TPG (TPG)·Q4 2025 Earnings Summary
TPG Crushes Q4 as AUM Hits $303B, FRE Jumps 72%
February 5, 2026 · by Fintool AI Agent
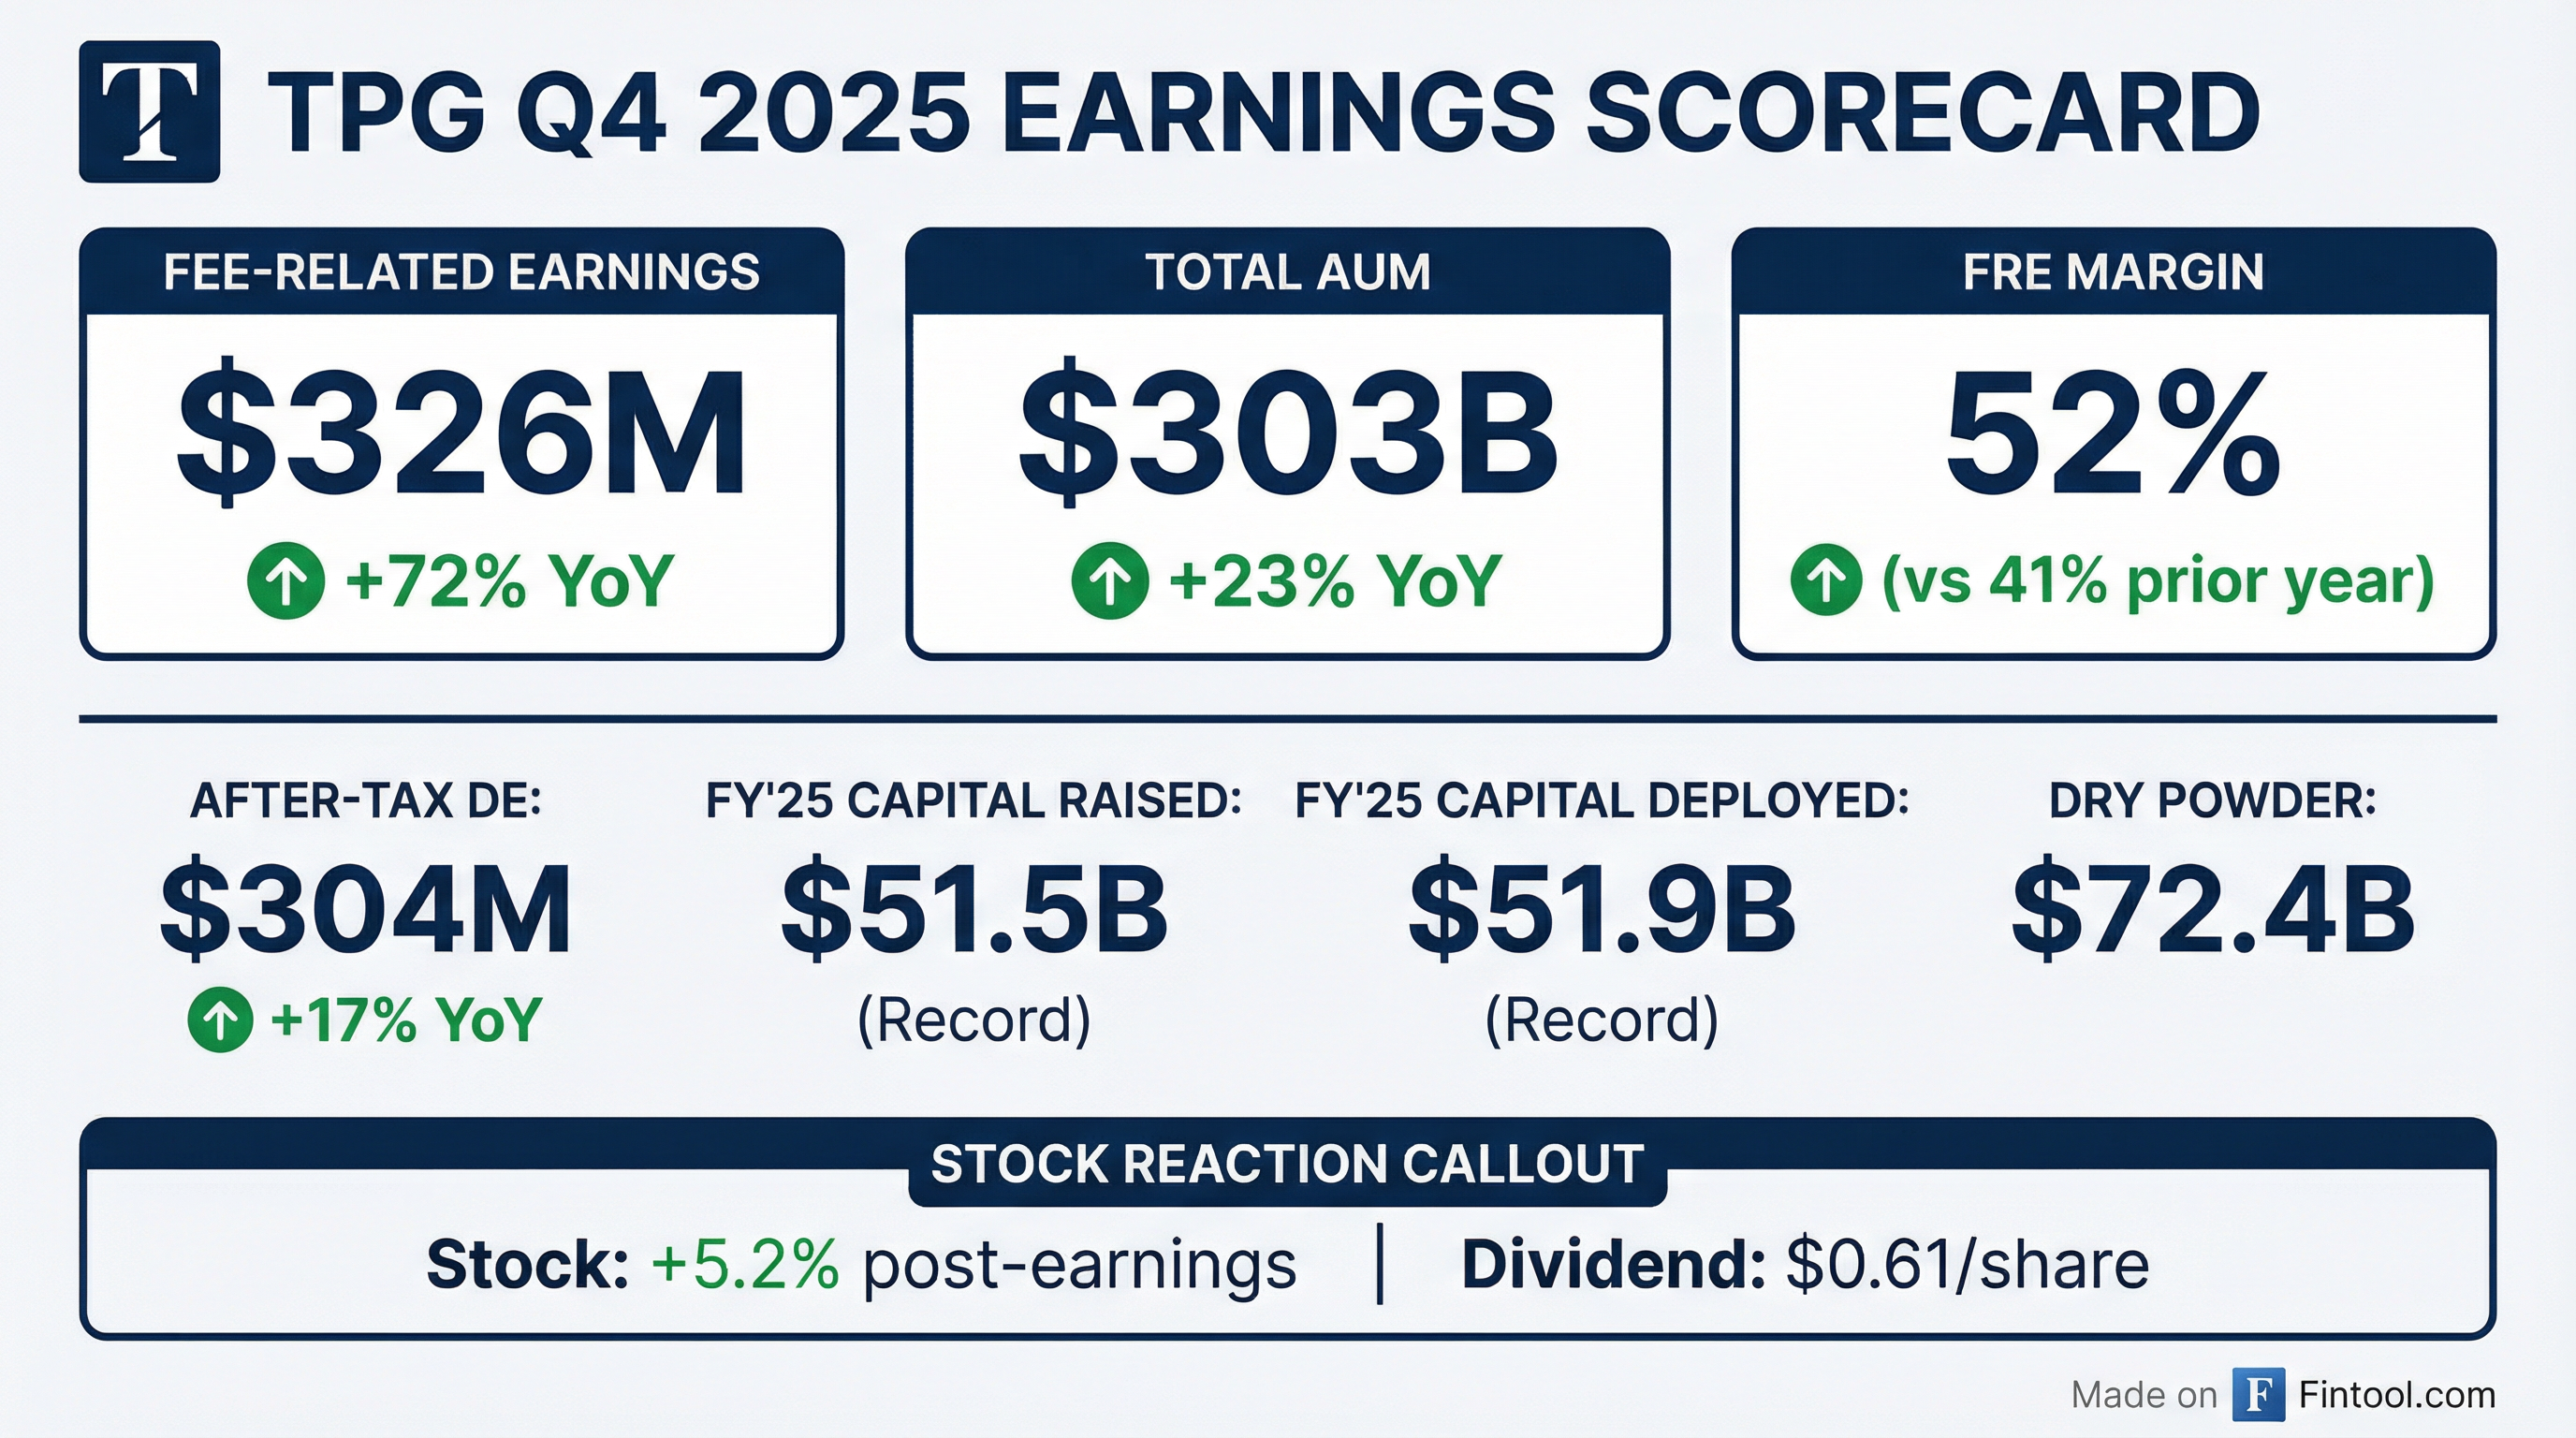
TPG delivered a blowout Q4 2025, with Fee-Related Earnings surging 72% year-over-year to $326 million as the alternative asset manager crossed the $300 billion AUM threshold for the first time. The firm raised a record $51.5 billion in 2025 and deployed $51.9 billion—both company records—cementing its position as one of the fastest-growing alternative asset managers in the industry.
CEO Jon Winkelried called 2025 "an outstanding year for TPG, marked by exceptional execution across our global franchise," noting that double-digit value creation across nearly all platforms drove AUM to more than $300 billion.
Did TPG Beat Earnings?
TPG delivered strong results that exceeded street expectations on fee revenues while EPS came in slightly below consensus due to lower realized performance allocations:
Beat/miss summary:
- Fee-Related Revenues: $628M actual vs ~$600M expected (+4.5% beat) — strong capital markets fees drove the upside
- After-tax DE per share: $0.71 vs $0.57 consensus (+25% beat)
- FRE Margin expanded 1,100 bps from 41% to 52%, demonstrating significant operating leverage
The FRE beat was driven primarily by capital markets fees (transaction, monitoring, and other fees of $122M in Q4, up from $36M in Q4'24) and management fee growth.
How Did the Stock React?
TPG shares jumped 5.2% to $56.09 in regular trading following the earnings release, with aftermarket trading pushing the stock to $57.12 (+7.1% from prior close). The stock had been volatile earlier in the week amid broader market turbulence related to tariff concerns.
Key price context:
- 52-week high: $70.38
- 52-week low: $37.52
- Current vs. 50-day avg: -10.9% below ($62.98)
- Market cap: $21.5 billion
The positive reaction reflects investor enthusiasm for TPG's accelerating fee growth and the strong FRE margin expansion, which demonstrates the operating leverage inherent in the alternative asset management model.
What Changed From Last Quarter?
Several significant developments distinguish Q4 from prior quarters:
1. FRE Margin Inflection FRE margin jumped to 52% from 44% in Q3 2025—the highest margin in the company's history as a public company. This reflects the scaling benefits as TPG grows its fee-paying AUM base.
2. Capital Markets Business Acceleration Transaction and monitoring fees surged to $122M from $38M in Q3 2025, driven by heightened deal activity and fee-generating exits.
3. Credit Platform Dominance Credit is now TPG's largest platform by AUM at $93B, surpassing Capital ($91B) for the first time. Credit raised $8.96B in Q4 alone.
4. Peppertree Integration Complete The July 2025 acquisition of TPG Peppertree added $7.9B in AUM and contributed to Market Solutions growth.
AUM Growth and Platform Breakdown
TPG's AUM reached $303 billion, up 23% year-over-year, with all six platforms contributing to growth:
Key fundraising highlights:
- TPG X (Capital): Raised $10.9B in FY25, the firm's largest flagship fund ever
- Credit Solutions III: Raised $4.0B, continuing momentum in direct lending
- Rise Climate II (Impact): Raised $1.9B for climate-focused investments
Fund Performance
TPG's investment platforms delivered strong returns across the board, with double-digit value creation in most strategies:
Flagship fund performance (Net IRR / Net MoM):
- TPG VIII (2019): 15% IRR / 1.5x MoM
- TPG IX (2022): 24% IRR / 1.3x MoM
- Asia VIII (2022): 16% IRR / 1.3x MoM
- Rise Climate I (2021): 15% IRR / 1.3x MoM
Balance Sheet and Liquidity
TPG maintains a strong balance sheet with ample liquidity:
Credit ratings: Moody's A3 / S&P BBB+ / Fitch A-
Long-term debt obligations total $1.75B, comprised of:
- Senior Notes due 2034: $600M
- Senior Notes due 2036: $500M
- Subordinated Notes due 2064: $400M
- Secured Notes due 2038: $250M
Dividend and Shareholder Returns
TPG declared a quarterly dividend of $0.61 per share, representing 85% of TPG Inc.'s share of After-tax Distributable Earnings per share.
Dividend details:
- Record date: February 19, 2026
- Payment date: March 5, 2026
At current prices ($56.09), the annualized dividend yield is approximately 4.3%.
What Did Management Say About Software and AI Risk?
One of the most notable Q&A exchanges addressed investor concerns about software exposure and AI disruption. CEO John Winkelried proactively addressed this "top of mind" topic:
"The question of where AI is an opportunity in technology and where it poses a risk is deeply embedded in our investment approach. As a firm who's been investing in AI solutions for over a decade, this is not a new question for us." — John Winkelried, CEO
Software exposure breakdown:
- Total AUM: 11% in software
- Credit AUM: Only ~2% software exposure (no ARR-based loans)
- PE AUM: 18% software exposure
Nihal Raj, co-managing partner of TPG Capital and software sector lead, outlined the firm's framework for identifying AI winners vs. losers:
Areas where AI is an opportunity:
- Vertical market software with proprietary data (e.g., Lyric — processes majority of US medical claims)
- Systems of record deeply embedded in workflows
- Cybersecurity firms (e.g., Delinea — benefits from AI agents needing identity/access)
Areas of higher risk:
- Horizontal applications not systems of record
- Infrastructure software not supporting new AI architectures
"We exited every one of our software companies in TPG VII and before during 2020-2022... Most of our software investment activity has resided in funds VIII, IX, and X, underwritten with knowledge of what's happening in generative AI." — Nihal Raj, Co-Managing Partner
Private Wealth Strategy: TPOP to More Than Double
The private wealth channel emerged as a key growth driver, with management providing bullish guidance:
Current scale:
- TPOP (private equity evergreen): 23% inception-to-date return, $1.5B total inflows through January
- TCAP (non-traded BDC): $4.5B AUM, redemption requests <1% of shares in Q4
- Platform partnerships: Now on 40+ platforms globally
2026 outlook from CFO Jack Weingart:
- "TPOP to more than double this year"
- Several new channel partners have already selected TPOP
- New products in development: multi-strategy credit interval fund and non-traded REIT
- Discussions ongoing for "bundled solutions" targeting mass affluent and eventually 401k market
What Did Management Guide for 2026?
Management provided specific guidance during the call:
Key 2026 fundraising building blocks:
- Real Estate: Major cycle begins — TREP V, Asia Fund, Japan Value Fund, TPG AG US Real Estate Fund
- Credit: Scaling IG ABF, CLOs, ADL, hybrid solutions
- Private Equity: Complete TPG Capital X and Healthcare Partners III, Sports Fund, Rise Fund, Peppertree
- Insurance: Jackson Financial partnership closing February 2026 (minimum $4B FAUM by year 2, $12B by year 5)
Capital deployment note: Ended 2025 with $19B of credit AUM subject to fee-earning growth, representing ~$130M of annual fee revenue when deployed.
Analyst consensus for upcoming quarters:
*Values retrieved from S&P Global
AUM Subject to Fee-Earning Growth: $40B at year-end, including $29B not yet earning fees.
What About Direct Lending Credit Quality?
In response to investor concerns about direct lending (prompted by Glenn Schorr of Evercore), management emphasized Twin Brook's differentiated lower middle market focus:
Twin Brook portfolio metrics:
- Non-accruals: Just over 1% (vs. higher rates at upper middle market peers)
- Interest coverage: >2x average
- Financial covenants: Always at least 2 per loan
- Revolver control: TPG controls the revolver, providing early warning visibility
"The lower middle market is fundamentally different than the upper middle market... We're not competing against the BSL market. It's not a race to the bottom with respect to terms, spreads, covenants." — Jack Weingart, CFO
Structural advantages cited:
- Generally the sole lender in transactions
- Higher spreads than upper middle market
- Loans are not PIK-ing (payment-in-kind)
- ~50% of originations are add-ons to existing portfolio companies
- Revolver draws serve as leading credit quality indicator
Executive Chairman Jim Coulter added context on LP flows:
"You can assume that issues around valuation and momentum are well understood in the LP market... watch the LP flows as a way of getting some comfort on that."
Key Risks and Considerations
Several factors warrant monitoring:
- Market Sensitivity: Alternative asset valuations are sensitive to interest rates and market conditions; rising rates could pressure unrealized gains
- Fundraising Competition: Intense competition for LP capital among large alternative managers
- Concentration: Credit is now the largest platform—performance issues there would be material
- Realization Timing: Realized performance allocations declined to $48M in Q4 from $105M in Q4'24, reflecting timing of exits
- Share Dilution: Equity-based compensation remains elevated at $240M for Q4 2025
- Jackson Partnership Risk: $500M investment in Jackson common stock funding via revolver increases net debt to $2.1B pro forma
The Bottom Line
TPG delivered an exceptional Q4 2025, demonstrating the power of its diversified platform model. The 72% surge in Fee-Related Earnings and the milestone of crossing $300B in AUM underscore TPG's transformation into a scaled alternative asset manager. With $72B in dry powder, a 52% FRE margin, and strong fund performance across platforms, TPG is well-positioned for continued growth.
The earnings call reinforced management's confidence with specific 2026 guidance: >$50B fundraising, ~47% FRE margin, and TPOP private wealth inflows expected to more than double. The proactive addressing of software/AI concerns—with data showing limited credit exposure (2%) and a thoughtful framework for PE investments—should help differentiate TPG from peers facing similar investor questions.
This analysis incorporates TPG's Q4 2025 earnings call transcript from February 5, 2026.
Related Links: